In this article:
Convert Dashboard Overview
With the Convert Overview Dashboard, you can identify your key sales trends and diagnose root cause from a single place. You can find this view by clicking here if you are signed into Cart Console, or by navigating to Convert>Overview in Unified Analytics:
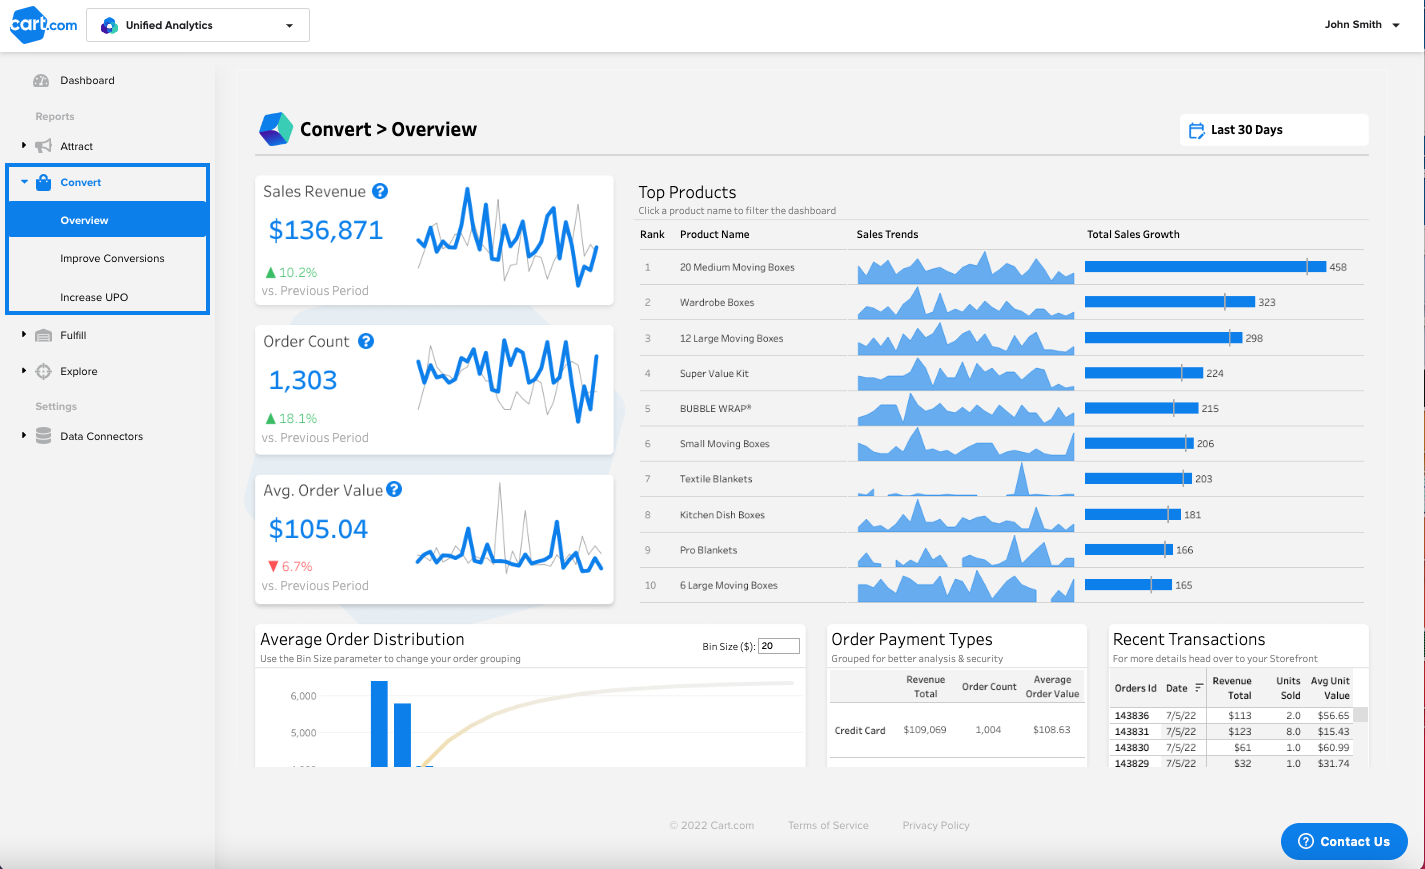
Store Performance
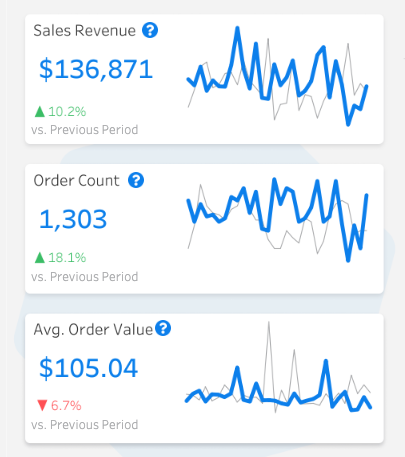
They are calculated as described below:
- Average Order Value: The average dollar amount spent each time the customer places an order. To calculate your company's average order value, divide total revenue by the number of orders.
- Order Count: The number of unique transactions sold through your store. This includes billed and pending transactions, but not cancelled.
- Revenue: All money generated from transactions. It does not include tax, but does include shipping, discount, and product totals.
Top Products Analysis
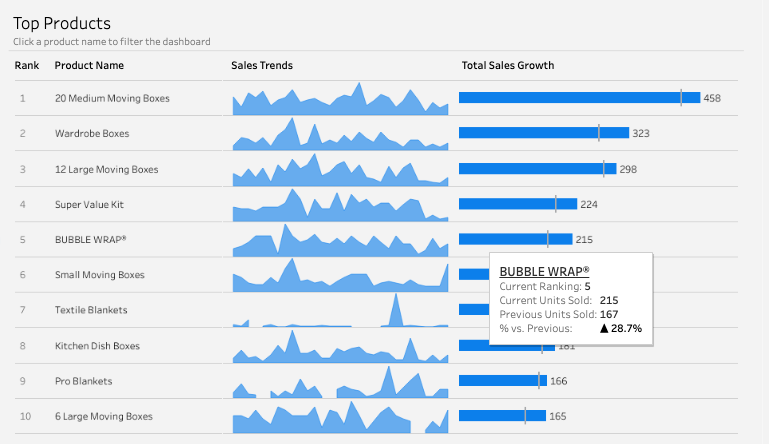
In the Top Products chart, you can view sales trends (blue bars) and historical benchmarks (grey ticks) for your top performing products to understand which SKUs are driving changes in aggregate business performance. Hovering over the Sales Trends and Total Sales Growth figures shows raw metrics for current and past performance.
For a deeper dive into a single SKU, you can click a product name to filter the dashboard and conduct SKU-specific analysis using the detail views below.
Details Drilldown
The bottom four graphics in the chart allow you to view order, payment, transaction, and marketing details in aggregate or for a selected product.
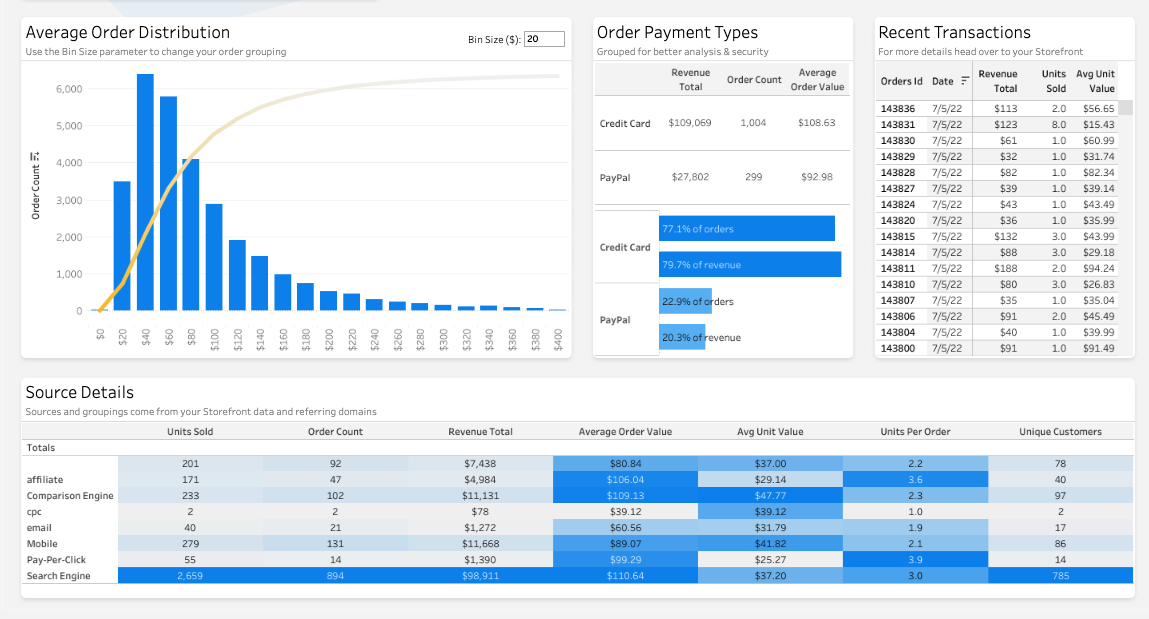
With the Average Order Distribution graphic, you can view an order value histogram to understand how much each range of order values contributes to overall revenue. For more order detail, you can view KPIs broken out by payment method and review recent transactions at an individual level.
The Source Details chart contextualizes store sales trends by displaying conversion performance by referring domain across a range of metrics.