In this article:
Explore Marketing Overview
Explore Marketing contains a set of visualizations to help you slice, dice, and export your data to answer any questions you have about marketing performance.
You can navigate to Explore Marketing by clicking here if you are logged into Cart Console or heading to Unified Analytics > Explore > Marketing:
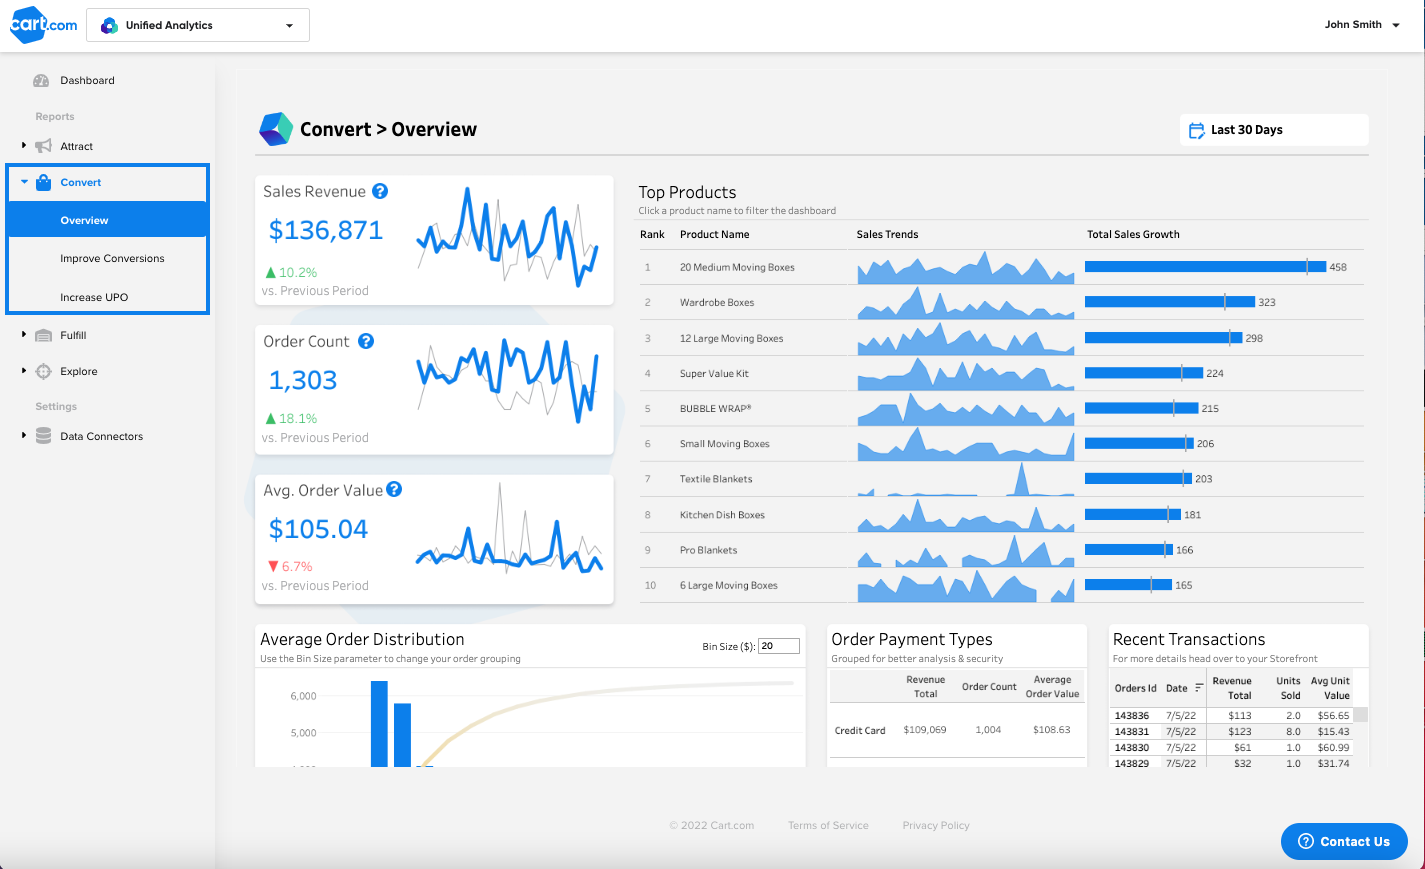
Explore Marketing lets you analyze trends, growth, and metric comparisons across nine key marketing measures: Impressions, Clicks, Conversions, Ad Spend, Revenue Pre Click, Cost Per Impression, Cost Per Click, and Return on Ad Spend.
All views are filterable by channel, campaign, connector, device, and date using the filter icon at the top right corner of the visual. Need to analyze your data elsewhere? No problem. Explore Marketing has easy export capabilities.
How to Export Your Marketing Data in the Details Table
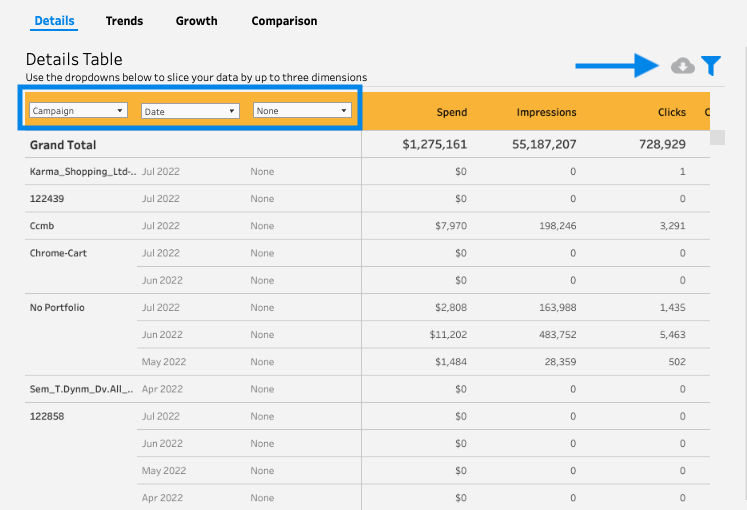
The Details Table within Unified Analytics allows you to view and export detail rows in a table. All nine marketing measures are included in the table by default.
With the three dropdown picklists highlighted in the blue box, you can format your table in rows grouped by up to three dimensions. To export to a CSV or Excel file, click the cloud icon to the top right of the table.
How to Compare Trends Across Groupings
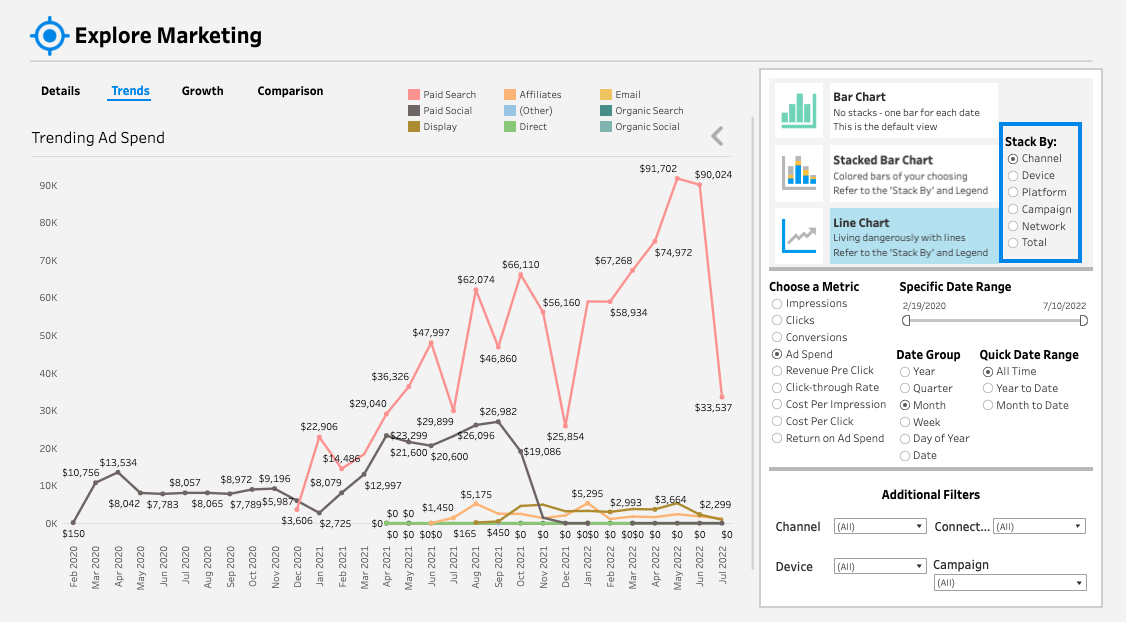
With the Explore Marketing Trends view, you can analyze marketing trends for any of the nine measures over time grouped by Channel, Device, Platform, Campaign, Network, or in total. The filter menu also allows you to switch between Bar and Line Chart views for your convenience.
This is helpful for determining how the marketing performance of certain groupings is growing or declining over time relative to other groups.
How to Analyze Growth or Decline Over Related Time Periods
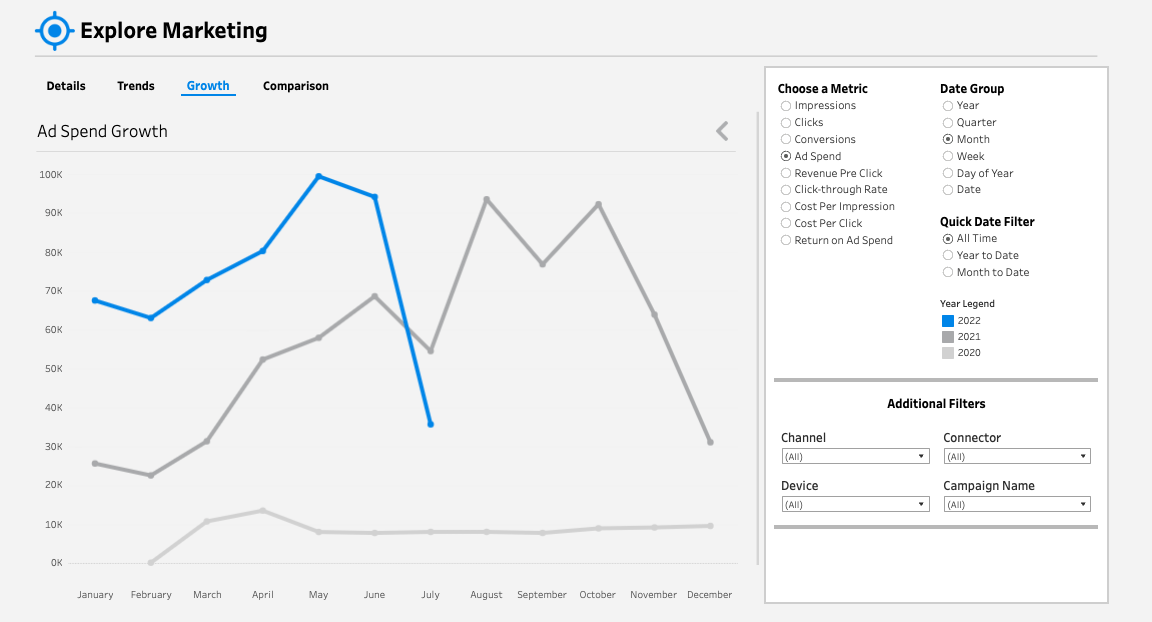
The Explore Marketing Growth View plots a given metric over a related time period for the current and two previous years. This view takes into account seasonality and makes it easy to draw relevant comparisons of how marketing metrics are performing against historical data. In addition to choosing between all of the key metrics and filters, you can also adjust time periods and date groupings.
How to Compare Metric Correlations Across Groupings
The Explore Marketing Comparison view allows you to view the relationship between two marketing measures compared across groups of your choice. This is helpful for identifying key drivers of marketing performance within groupings to optimize how marketing budget is allocated.
For example, in the screenshot below we compare Return on Ad Spend and Cost Per Click across all channels. We can see that our Affiliate channels are achieving very high returns with relatively cheap Cost Per Click, while our Paid Social channels are much more expensive and providing minimal return. In this scenario, we could reallocate marketing dollars from our Paid Social program to our Affiliate program to drive better returns.
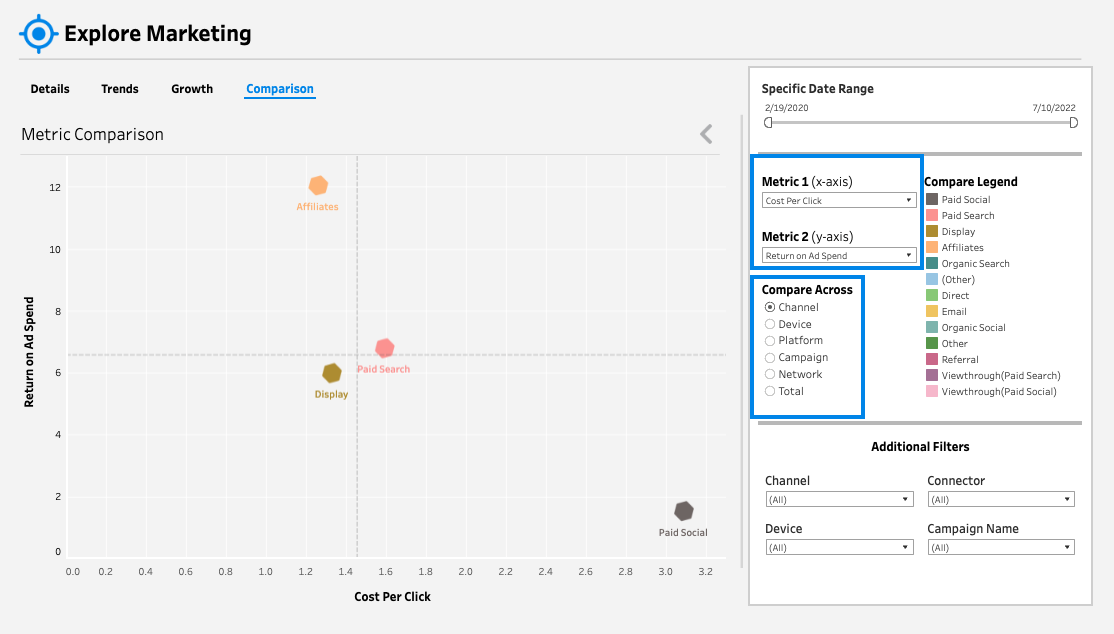
You can conduct these types of comparisons across all metrics and groupings by adjusting the filters highlighted with blue boxes in the image above.