In this article:
Paid Search & Social Dashboards Overview
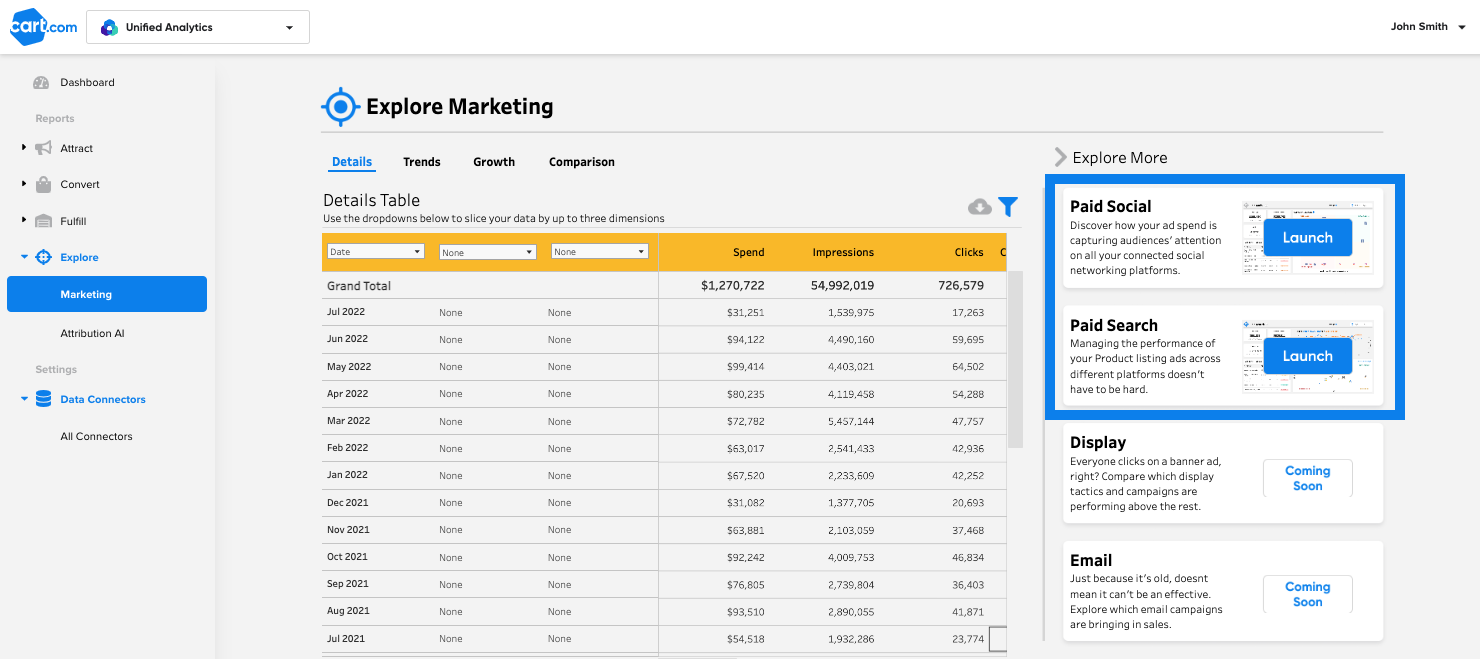
The Paid Search and Social Exploration pages provide analysis of how marketing campaigns are performing relative to spend and surface recommendations to help shift your budget to the most effective campaigns.
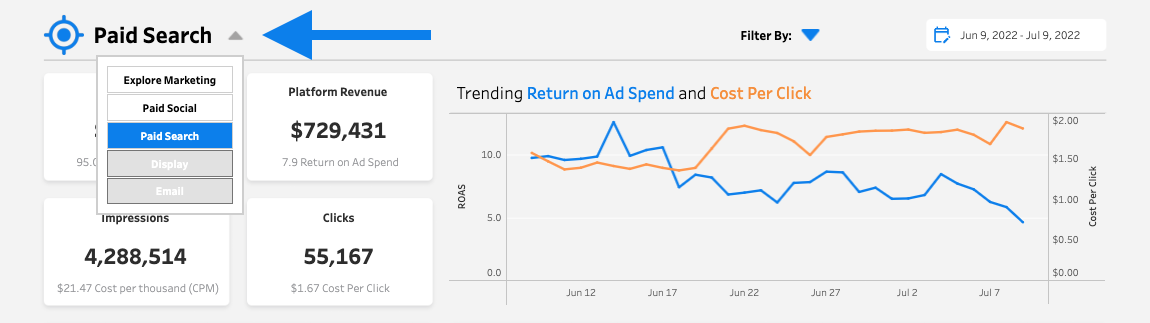
You can access these views by clicking here if you are signed into Cart Console, or navigating to Unified Analytics > Explore > Marketing:
Channel Performance Overview
Filterable by data connector and time period, the top row of the dashboard gives an at-a-glance overview of how your Paid Search or Social ads have been performing.
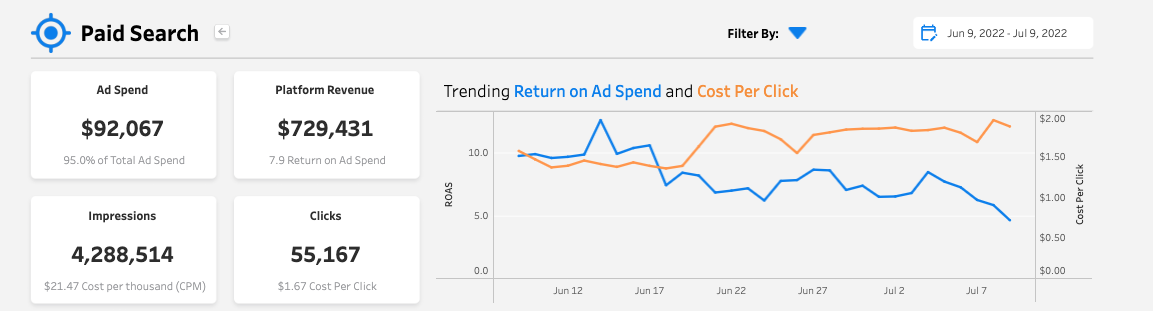
For the selected time period and connectors, you can quickly understand how the channel contributes to your overall spend and performance:
-
Ad Spend - Amount spent on ads and its contribution to total overall ad spend
-
Platform Revenue - Total attributed revenue from ads and return on each dollar of spend ($7.90 in revenue for each ad dollar in this example)
-
Impressions - Total impressions generated and the cost per thousand impressions (CPM)
-
Clicks - Total clicks generated and the cost per click (CPC)
Return on ad spend (ROAS) and CPC (or CPM for social) are plotted over the time period to give you a sense for how they trended over the time period.
How to Optimize Paid Search Spend
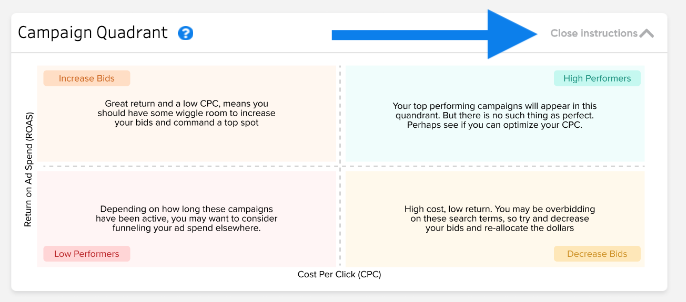
Paid Search campaigns that strike a balance of a high ROAS and balanced CPC drive the most margin for your business. Unified Analytics analyzes each of your campaigns and sorts them into four categories with a recommended set of actions:
-
Increase Bids (high ROAS, low CPC) - These campaigns are low-cost and performing well. You can likely generate even better returns by increasing your bids to secure a top spot in the search results
-
Decrease Bids (low ROAS, high CPC) - These campaigns are expensive and not generating good returns. You may be able to decrease your bids without major performance implications and reallocate that spend elsewhere
-
High Performers (high ROAS, high CPC) - These campaigns are driving strong returns with acceptable costs. While looking to optimize your CPC is always encouraged, these are healthy campaigns.
-
Low Performers (low ROAS, low CPC) - These campaigns are not driving strong returns. It is worth considering funneling your ad spend elsewhere.
How to Use the Paid Search Dashboard to Identify Campaign Adjustments
The Paid Search dashboard provides two visuals that make identifying campaign adjustments easy. On the left, the Campaign Readout shows all of your active Search campaigns for the selected time period and connectors along with their key KPIs and adjustment recommendations.
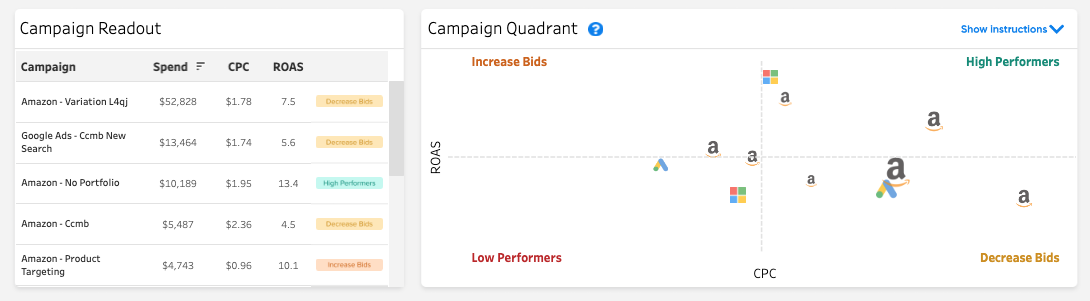
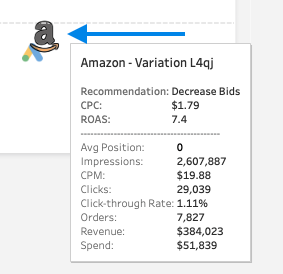
The Campaign Quadrant plots each campaign by ROAS (vertical axis) and CPC (horizontal axis) with the recommendation categorizations labeled in each quadrant. Campaigns are represented with the logo of their platform, and the size of the logo is indicative of the campaign budget. Hovering over the campaigns will reveal further information about their performance:
Campaign Adjustment Process in Summary:
-
Identify the campaigns in the Increase Bids, Decrease Bids, and Low Performers Categories
-
You can do this by scrolling through individual campaigns in the Campaign Readout view or by category in the Campaign Quadrant. You can always click “Show Instructions” in the Campaign Quadrant to remind yourself of the recommendations for each category:
-
-
Adjust your ad spend on those campaigns based on the associated recommendations
-
Adjusting larger campaigns that are further to the edges of the quadrants will typically have the most impact.
-
-
Continuous Monitoring & Adjustment
-
Continue to monitor your marketing performance to identify further adjustments.
-
How to Optimize Paid Social Spend
The Paid Social dashboard provides two visuals that make identifying campaign adjustments easy. On the left, the Campaign Readout shows all of your active Search campaigns for the selected time period and connectors along with their key KPIs and adjustment recommendations.
-
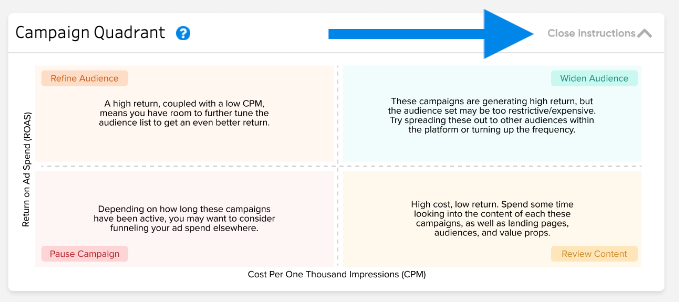
Refine Audience (high ROAS, low CPM) - These campaigns are low-cost and performing well. You can likely generate even better returns by refining your audience.
-
Pause Campaign (low ROAS, low CPM) - These campaigns are not driving strong returns. It is worth considering funneling your ad spend elsewhere.
-
Widen Audience (high ROAS, high CPM) - These campaigns are driving strong returns, but the audience set is likely too restrictive and expensive. Widening the audience and/or increasing frequency may improve your returns.
-
Review Content (low ROAS, high CPM) - These campaigns are expensive and not generating good returns. It is likely worth reviewing ad content, audiences, or landing pages to see if you can improve conversion.
How to Use the Paid Social Dashboard to Identify Campaign Adjustments
The Paid Social dashboard provides two visuals that make identifying campaign adjustments easy. On the left, the Campaign Readout shows all of your active Social campaigns for the selected time period and connectors along with their key KPIs and adjustment recommendations.
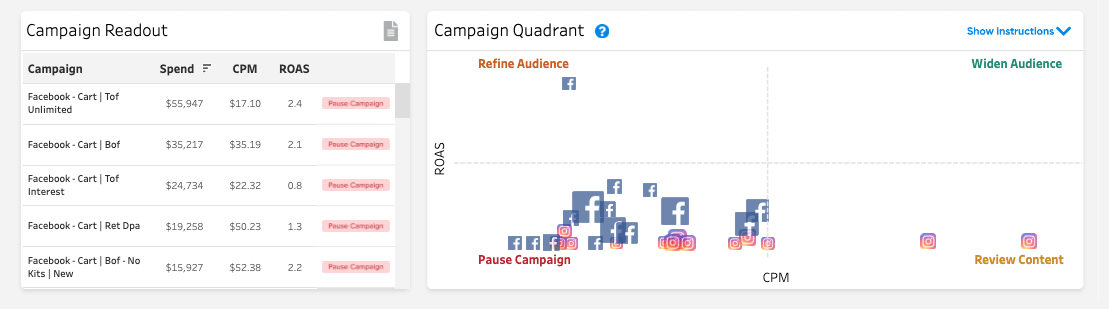
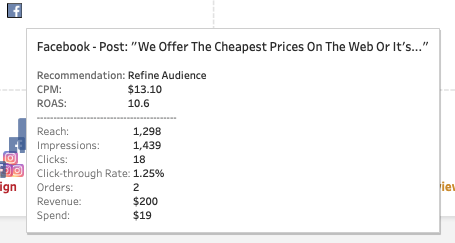
The Campaign Quadrant plots each campaign by ROAS (vertical axis) and CPM (horizontal axis) with the recommendation categorizations labeled in each quadrant. Campaigns are represented with the logo of their platform, and the size of the logo is indicative of the campaign budget. Hovering over the campaigns will reveal further information about their performance:
Campaign Adjustment Process in Summary:
-
Identify the campaigns to the furthest extremes of the quadrants
-
You can do this by scrolling through individual campaigns in the Campaign Readout view or by category in the Campaign Quadrant. You can always click “Show Instructions” in the Campaign Quadrant to remind yourself of the recommendations for each category:
-
-
Adjust your ad spend on those campaigns based on the associated recommendations
-
Adjusting larger campaigns that are further to the edges of the quadrants will typically have the most impact.
-
-
Continuous Monitoring & Adjustment
-
Continue to monitor your marketing performance to identify further adjustments.
-