

Table of Contents
Prime Big Deal Days 2026, held October 6 and 7, generated $9.86 billion in U.S. online sales, up 8.5% from $9.09 billion in 2025, according to Adobe. Numerator’s shopper data shows the average Amazon order rose 7% to $48.74, while 68% of items purchased sold for under $20.
Across the Amazon brands managed by Commerce Services by Cart.com, total revenue grew 26% year over year and organic revenue grew 33%, which means growth came from stronger baseline demand and not only from advertising. Ad impressions roughly doubled, clicks rose 68%, and cost per click fell 22%. Brands selling through Seller Central grew revenue 44%, while revenue from the vendor model fell 59%. Growth was strongest in apparel, beauty, men’s grooming, supplements and women’s health.
The lesson for Black Friday, Cyber Monday and the weeks after Christmas is straightforward: shoppers are hunting for value, brands that control their own pricing and promotions win, and organic demand built in October carries into November.
Prime Big Deal Days 2026 by the Numbers
Prime Big Deal Days has become more than a fall sale. It now works as Amazon’s holiday kickoff, a Prime membership drive, a chance for brands to clear inventory ahead of Black Friday and Cyber Monday, and a major source of demand heading into peak Q4. The 2026 results confirm that role.
According to Adobe data reported by Digital Commerce 360, U.S. online sales across all retailers reached $9.86 billion over the two days, up from $9.09 billion in 2025. Numerator’s household panel, reported by Chain Store Age, found average household spend rose 9% to $114.01 and average order size rose 7%, from $45.42 to $48.74.
| Metric | 2026 result | Source |
|---|---|---|
| U.S. online sales, all retailers | $9.86 billion, up 8.5% YoY | Adobe |
| Average Amazon order size | $48.74, up from $45.42 | Numerator |
| Average household spend | $114.01, up 9% | Numerator |
| Items purchased under $20 | 68% | Numerator |
| Items purchased over $100 | 2% | Numerator |
| Most-purchased categories | Beauty and cosmetics, apparel, health and wellness | Numerator |
Did Prime Big Deal Days 2026 grow compared with 2025?
Yes. Prime Big Deal Days 2026 generated $9.86 billion in U.S. online sales, up 8.5% from $9.09 billion in 2025, according to Adobe. Numerator found the average Amazon order grew 7% to $48.74 and average household spend grew 9%. Shoppers bought more and spent slightly more per order, but most items were still low-priced, with 68% selling for under $20.
Value-Seeking Defined the Event
The clearest consumer signal from the event was value. In Numerator’s Prime Big Deal Days tracker, 68% of purchased items sold for under $20, and only 2% cost more than $100. Shoppers filled their carts with everyday products in beauty, apparel and health and wellness rather than big-ticket purchases.
Order size also held steady across the year. The $48.74 average order during Prime Big Deal Days was close to the $48.99 Numerator measured during the summer Prime Day event in June. That consistency matters for planning. It suggests a shopper who is still buying in volume but is careful about price, and who responds to well-timed deals on products they already use.
What Cart.com’s Portfolio Data Shows
Amazon-wide figures describe the market. First-party data from the Amazon brands Cart.com’s marketplace team manages shows how individual brands turned that market into results. The figures below compare Prime Big Deal Days 2026 with the same event in 2025, in aggregate across the portfolio.
Organic Demand Drove Most of the Growth
Organic revenue grew 33% year over year, faster than total revenue growth of 26%. That gap is the most important finding in the data. Brands were not simply buying growth through advertising. They benefited from stronger baseline demand, better merchandising, well-planned promotions and more branded search activity, all of which compound over time and keep working after the event ends.
Ad Traffic Reached Record Levels at a Lower Cost
Advertising scaled sharply. Impressions across the portfolio rose 101% and clicks rose 68%, while cost per click fell 22%. Brands reached far more shoppers and paid less for each visit.
Prime Big Deal Days 2026 vs. 2025: Cart.com Amazon portfolio year-over-year change in ad impressions, clicks, revenue, ad spend and cost per click
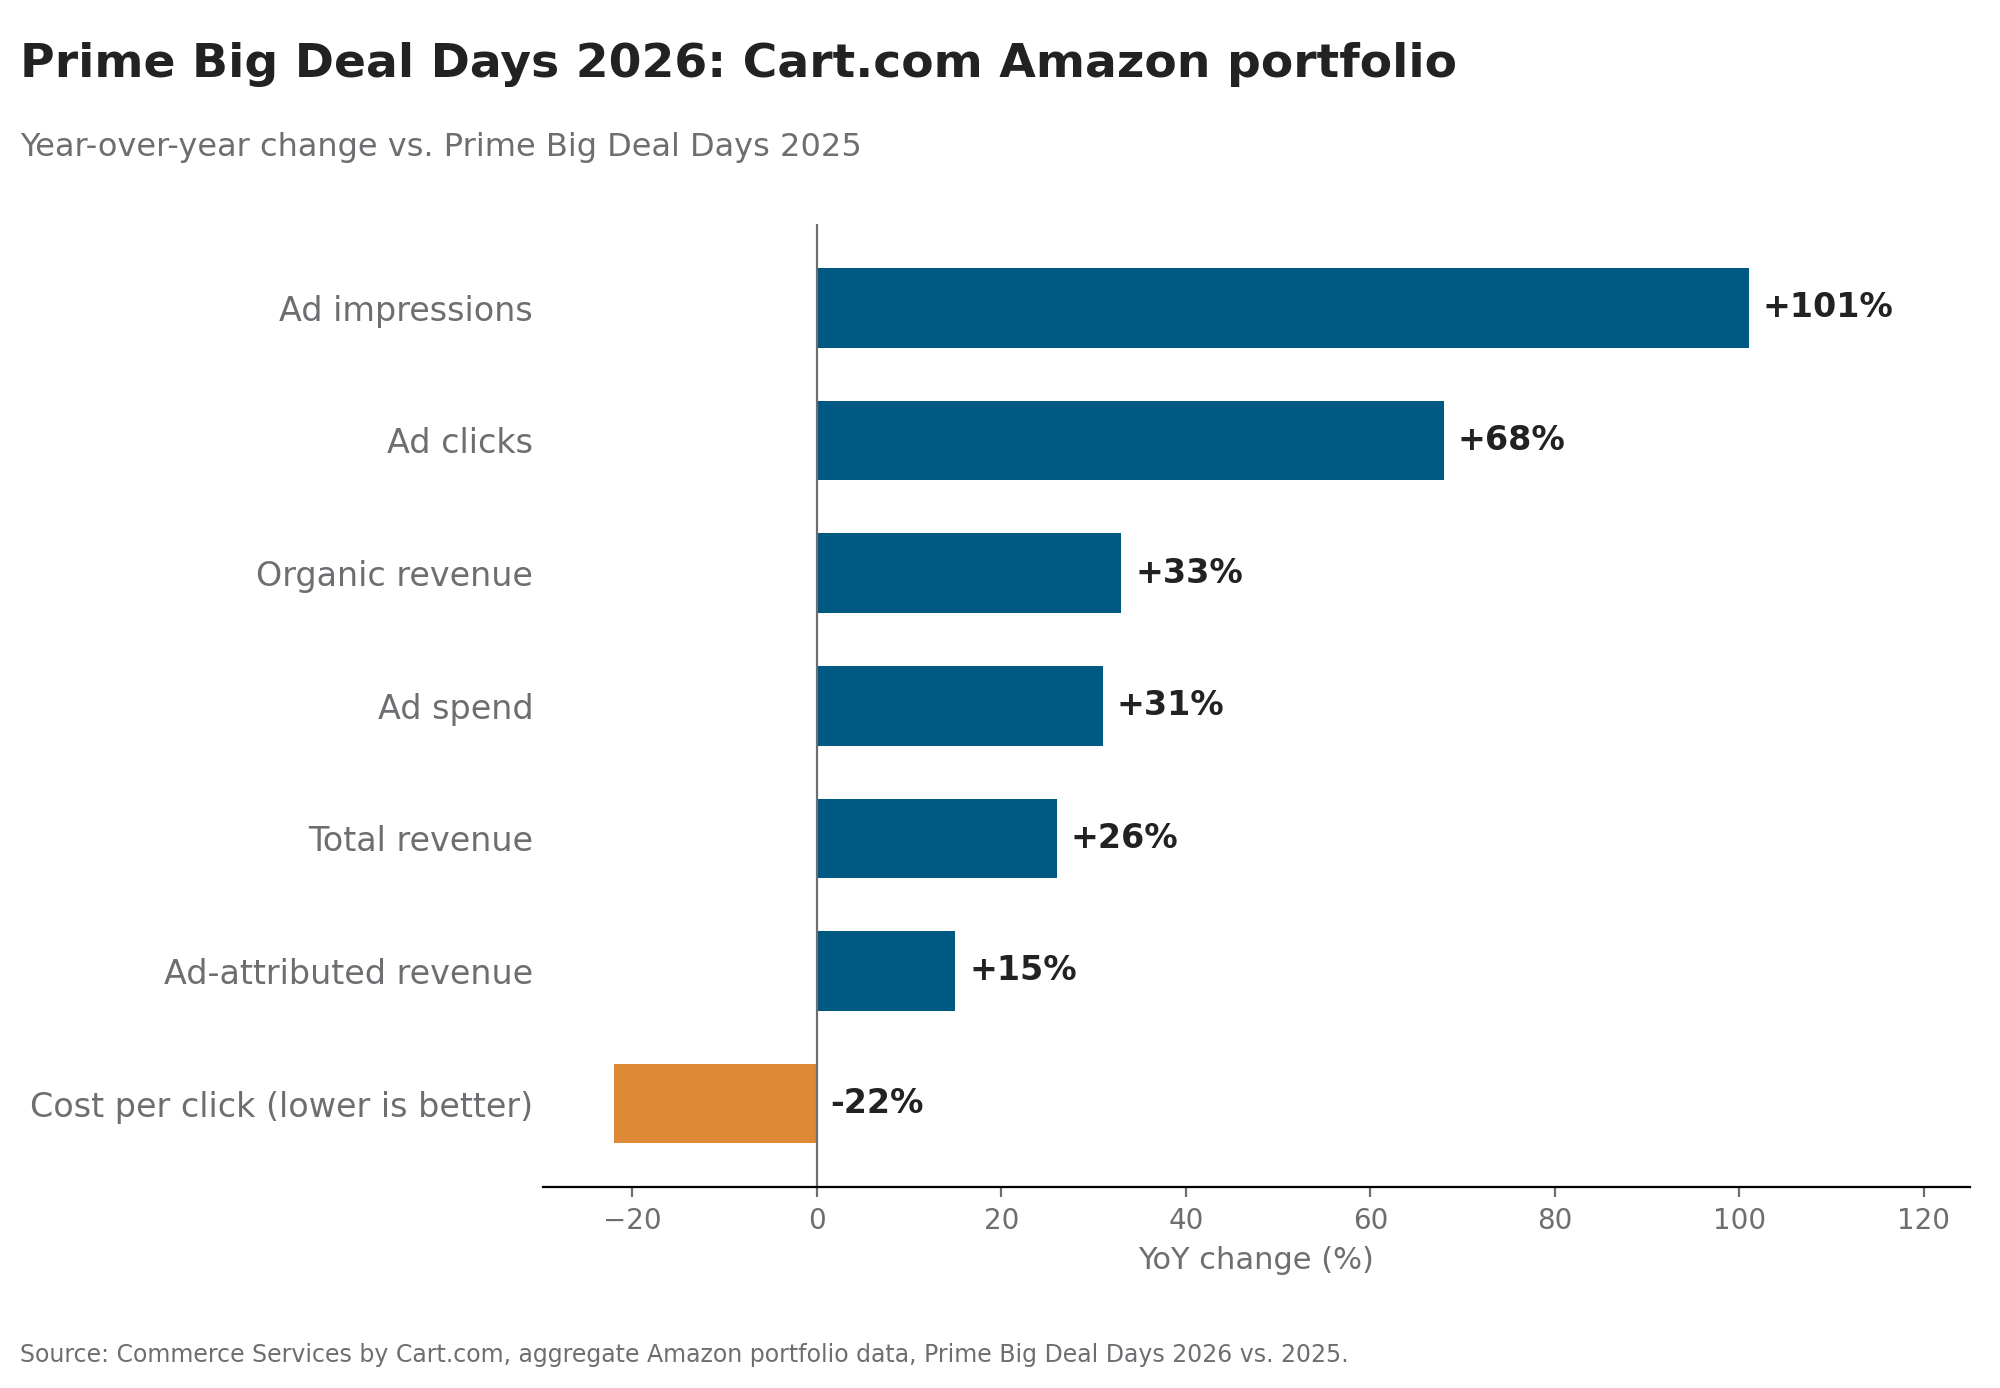
Ad spend rose 31% while ad-attributed revenue grew 15%, so return on ad spend moved from 2.69 to 2.37. That was a deliberate choice. The strategy favored new-to-brand reach and market share over short-term efficiency, putting more budget into the upper and middle of the funnel where shoppers discover a brand for the first time. With cost per click down and organic revenue growing faster than total revenue, the added scale more than offset the softer efficiency, and those new customers are now in position to buy again during Black Friday and Cyber Monday.
Seller Central Brands Outpaced Vendor Brands
Revenue from brands selling through Seller Central grew 44% year over year, while revenue through the vendor model fell 59%. The same pattern appeared during the summer Prime Day event. In Seller Central, brands set their own prices, choose their own deals and control their own advertising, so they can react to competitors and demand during a two-day event. That agility is worth more when shoppers are this focused on value.
Growth Concentrated in Core Categories
Category performance across the portfolio lined up closely with what Numerator saw across Amazon, where beauty, apparel and health and wellness were the most-purchased categories.
| Category | YoY revenue growth, Cart.com portfolio |
|---|---|
| Women’s Health | +40% |
| Supplements | +33% |
| Apparel | +31% |
| Men’s Grooming | +31% |
| Beauty | +24% |
Lessons for BFCM and Q5
The first lesson is to protect organic momentum. The traffic and new-to-brand customers a brand earned in October improve its organic ranking and branded search going into November. Brands should keep listings, images and A+ content current, keep reviews flowing, and avoid cutting advertising so hard after the event that organic rank slips just before Black Friday.
The second lesson is to price for a value-focused shopper. With 68% of Prime Big Deal Days items selling for under $20, brands with higher price points should lean on bundles, multipacks, subscribe-and-save offers and coupons that lower the effective price without permanently resetting it. Brands that already sit in that range should plan deal depth carefully, because shoppers will compare prices across retailers before they buy.
The third lesson is to treat control as a competitive advantage. The 44% Seller Central growth against a 59% vendor decline shows how much pricing agility, deal flexibility and media control matter at peak. Brands in the vendor model should confirm how quickly they can change pricing and promotions in November, and whether a hybrid approach would give them more control over their highest-volume products.
The fourth lesson is to plan inventory for the whole season, not one weekend. Stockouts during Black Friday and Cyber Monday cost sales and organic rank at the same time. Brands should check inbound timelines and capacity limits now, using Prime Big Deal Days sell-through as a guide, and keep enough stock to cover Q5, the stretch from late December into January when shoppers spend gift cards and advertising costs typically drop.
The fifth lesson is to measure growth and efficiency together. A lower ROAS is not a problem when it reflects deliberate investment in new customers and organic revenue is rising faster than total revenue. Brands should agree on their goals before peak season begins, whether that is market share, new-to-brand customers or profit per order, and judge results against them.
What should Amazon brands do before Black Friday and Cyber Monday?
Amazon brands should keep advertising steady after Prime Big Deal Days so organic rank holds, plan deals and bundles for a value-focused shopper, confirm they can change prices and promotions quickly, and secure enough inventory to cover Black Friday, Cyber Monday and Q5. They should also set clear goals for growth versus efficiency before peak season begins.
Frequently Asked Questions
How much did Prime Big Deal Days 2026 make?
Prime Big Deal Days 2026 generated $9.86 billion in U.S. online sales across all retailers over October 6 and 7, according to Adobe. That was up 8.5% from $9.09 billion in 2025.
What was the average order value during Prime Big Deal Days 2026?
According to Numerator, the average Amazon order during Prime Big Deal Days 2026 was $48.74, up 7% from $45.42 in 2025. That was close to the $48.99 average Numerator measured during the summer Prime Day event.
What sold best during Prime Big Deal Days 2026?
Numerator found beauty and cosmetics, apparel, and health and wellness were the most-purchased categories. Across the Amazon brands Commerce Services by Cart.com manages, women’s health grew 40%, supplements 33%, apparel and men’s grooming 31% each, and beauty 24%.
Is Prime Big Deal Days a good predictor of Black Friday performance?
It is a useful early signal. Prime Big Deal Days shows how shoppers respond to price, which products and categories have momentum, and how well a brand’s inventory and advertising hold up under peak demand. The traffic and customers a brand gains in October also strengthen its organic ranking heading into November.
Should brands accept a lower ROAS during Amazon sales events?
Sometimes. A lower ROAS can be the right result when a brand is deliberately investing in new-to-brand customers and market share, as long as organic revenue and total revenue are growing. The key is to set the goal before the event and measure against it.
What is Q5 in ecommerce?
Q5 is the period from roughly December 26 into mid-January. Shoppers spend gift cards and holiday cash while many advertisers pull back, so advertising costs often fall and well-stocked brands can capture sales at better margins.
Related Reading
Content, Ads and Inventory: Why Your Marketplace Needs One Growth Plan, Not Three
What Is Amazon Listing Optimization?
What Is a Managed Marketplace Service?
Peak season rewards brands that plan advertising, pricing and inventory as one strategy. Commerce Services by Cart.com brings Amazon advertising, listing management and marketplace operations together with a nationwide fulfillment network, so brands can turn October momentum into a stronger Black Friday, Cyber Monday and Q5. Explore Cart.com’s marketplace services or talk to our team about your peak season plan.