Formula 1’s popularity is reaching new speeds, in major part due to the hit documentary series Drive to Survive and the ensuing “Netflix Effect”. Viewers tune in for the driver drama and feuds over car design that make up each episode, with audio from the drivers’ frustration as the secondary soundtrack.
The Netflix series also shows us how a driver’s ability to “feel” what’s on or off about a car is one of the many skills they bring to a racing team—though despite what you see on camera, no team will tell you they can rely on feeling alone. The truth is that today’s F1 cars have over 300 sensors that transmit between 2-3GB of data each race.
This data is crunched in real time by analysts who are augmenting the feel of the drivers with predicted outcomes based on race position, performance and other factors. All this ladders up to recommendations they provide to the management team in the pit.
Mercedes was the first reported team to leverage predictive data and inform in-the-moment racing decisions starting in 2013. This coincided not only with an 8-year winning streak, but also a race among all other teams to follow suit.
Much like F1, we work in an industry rich with data and can take lessons from these Pavement Pioneers. Almost every interaction online creates some form of digital exhaust. Big brands have long known how to repurpose that exhaust for their own benefit … on the other hand, small to mid-sized businesses haven’t always had the tooling to use it in the same way.
Am I suggesting you make the same level of investment to keep up? Absolutely not. But chances are, you’re unintentionally making it easier for others to pass you on the track while racing for ecommerce glory. Here are the most likely signals you’re falling behind the competition:
Losing signal #1: Your most vocal team members influence priorities
The squeaky wheel gets the grease whether we like it or not. This leads to businesses prioritizing the loudest problems, instead of the most impactful ones. And because individuals amplify the pain of problems they don’t want to deal with, focus is often put on annoying, yet inconsequential, areas. This would be like F1 giving a trophy on race day to the angriest driver who threw their helmet across the track (spoiler alert, helmet throwing happens often).
This frequently happens in ecommerce operations, where significant energy is spent tracking SLA performance of a company’s vendors. Their performance is important, but the overall impact of month-to-month changes is mostly miniscule. In the constant battle of deploying too few resources and too little time, leaders need to have a better approach to prioritization than listening for loud problems.
One method to align an organization on the most impactful areas is to generate multiple versions of the question “How might we…?”, followed by ambitious targets that are impossible to meet with today’s operations (see Fig. 1 below). The purpose is not to set these targets as company goals, but simply to drive the mindset of radical focus and thinking.
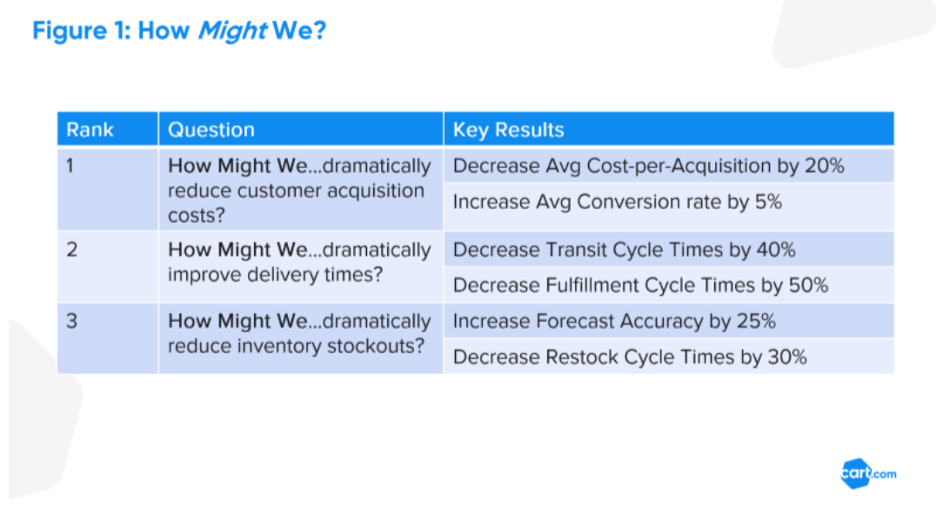
Once the team lists more than 20 “How might we … ?” questions, they can then collectively force-rank the list, narrowing down to no more than three. These three questions are now a forcing function on which to align the organization, and areas for teams to contribute their answers. Why three? Ever seen a 200+ mph car hit the throttle, brake and paddle shifter at the same time? There’s even less success when businesses do more than three things at once.
With a renewed alignment on the most important focus areas for your business, it becomes even easier to identify which management decisions deserve more investment.
Losing signal #2: You’re relying solely on historical experience to drive decisions
Your past learnings are the best weapon in your future races, right? Wrong. A golden rule in business is that you’re either growing or you’re dying, and as you (hopefully) grow, it’s just as likely what worked for the last audience won’t work for the next one. How do growing brands make the best decisions? McKinsey Consulting states that ecommerce companies who rely on data in driving decisions “outperform peers by 85% in sales growth and more than 25% in gross margin”.
OK, but what does this mean? You go to whatever platforms you use, run Excel pivot tables on your data and POOF … 85% increase in sales! That’d be nice. Driving decisions with data means understanding which metrics give you the earliest health signals possible, so you can proactively change the next outcome. For example, by knowing the projected customer lifetime value (CLV) of a new audience segment, you can better monitor a campaign’s performance to make creative adjustments if the early return on ad spend (ROAS) is lower than expected. In Figure 2 below, we provide a sample of common metrics ecommerce brands use to monitor the revenue growth of their businesses and to support future decision-making. Each metric provides early signals for separate decisions, so it’s critical to know which are more important for your business.
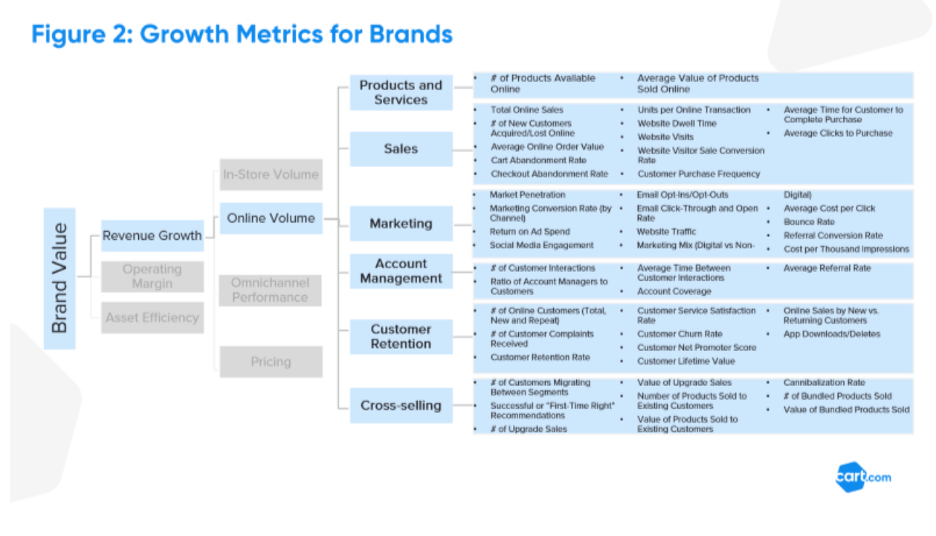
Leveraging these metrics, brands can focus decisions on key activities:
- Because comparing ROAS and cost per thousand impressions (CPM) indicates what the next steps should be in a paid search strategy, brands should widen their campaigns’ target audiences when it has a high CPM and high ROAS.
- Because low site speeds are a predictor of higher bounce rates, brands should reduce page content if load times vary drastically based on traffic volume.
- Because bundling is a great strategy for increasing average order value (AOV), brands should monitor the value of bundled products sold and % of bundled products sold to modify which products are sold together.
After ranking critical business metrics, we can then explore what’s technically feasible to monitor these metrics, asking where there are gaps and how difficult this gap is to cover based on the importance to the business. An alternative is to then explore a proxy metric (something not exact but is directionally correct) if the gap can’t be closed within a reasonable time.
Losing signal #3: You’re building a factory of fun facts
What’s a Fun Facts Factory? It’s taking every metric from Fig. 2 above and calculating them before knowing how they’ll help make better decisions. It’s like watching one of the Fast & Furious films and thinking that putting a Blower on your F1 race car is a good idea. A more visual example of a Fun Facts Factory can be seen in Fig. 3 below and is common on most of today’s commerce platforms or analytics tools. They leave the “So what?” of answering meaningful business questions to be desired.
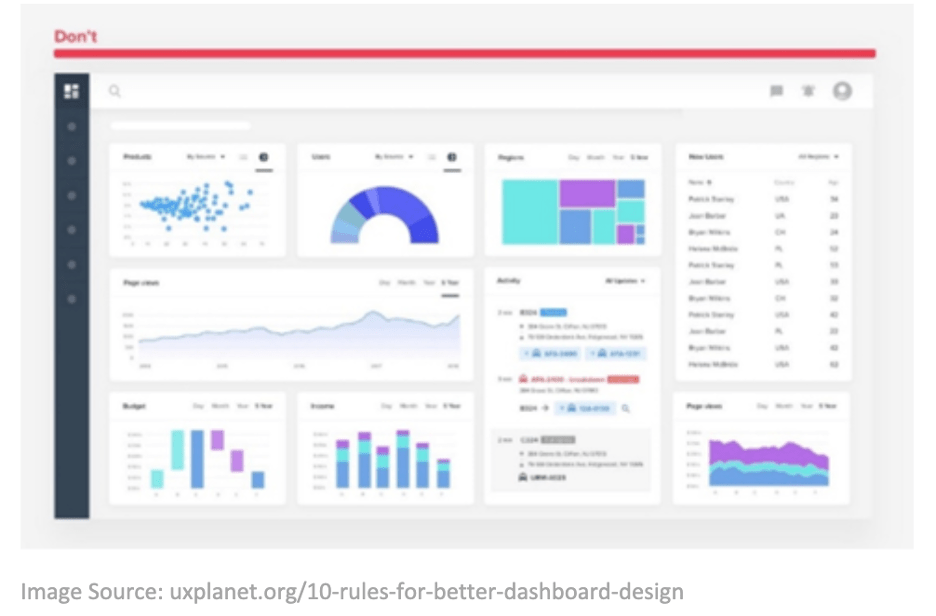
Fun Fact Factories are becoming increasingly present in today’s world of modern UIs and self-service analytics platforms. They’re built by technical professionals or business analysts instead of decision-makers. Sure, they’re nice to look at but do they help you make strategic or operational decisions? Probably not. In fact, it’s more likely these tools will divert your attention from the problem at hand and instead direct your attention to explore multiple, meaningless rabbit holes.
Am I suggesting getting rid of your dashboards? Of course not. But I am suggesting a more focused approach. This is where Value Ladders come in. A Value Ladder maps out which daily activities (i.e. impressions, orders, returns) and management metrics (i.e. CLV, cycle time, customer satisfaction) “ladder-up” to influence North-Star metrics like revenue, market share and profitability. Fig. 4 below is an example of a Value Ladder for fulfillment, explaining how business efficiency and effectiveness metrics can influence key targets for profitability and service.
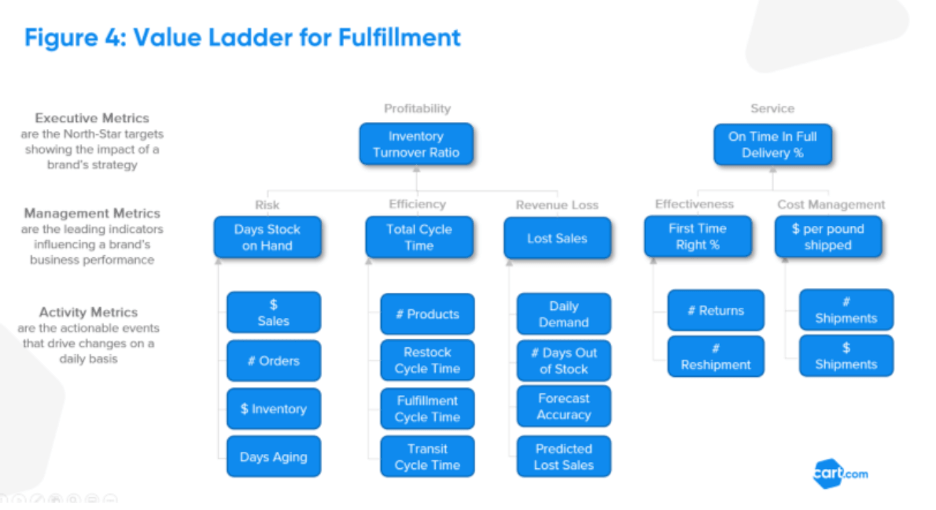
In the example, three proxy metrics are used as potential influencers of inventory turnover ratio, which are designated as the most important but also least overlapping metrics. Sure, there is some correlation between days stock on hand, total cycle time and lost sales – but changes in each will mean very different corrective actions. To be more specific:
- If days stock on hand gets too high, it will reduce my overall profitability. I’d want to further analyze my inventory aging across SKUs to identify where pricing/promotion changes will correct this trend.
- If total cycle time is creeping up, it will again reduce my overall profitability, but the corrective action depends on if restock, fulfillment or transit cycle times are the root cause.
- If lost sales are increasing, then my inventory planning may be too conservative and larger inventory buffers are needed.
Once leaders generate a perspective on the influencers or “Value Ladders” of business success and which actions should be considered when unfavorable trends occur, teams can organize methods to monitor and improve business performance in their day-to-day activities.
Losing signal #4: You’re acting as if winning comes later
WARNING: Breaks are out. Crash imminent.
If you’ve reached this far, congratulations. You at least recognize there’s a problem. The bad news? Your likely reaction to this article has been “It sounds great in theory, but we can’t do that because … ”
- Our data is too messy
- Our team doesn’t have the right skills
- Our processes need to be standardized
- Our technology is outdated
This is a losing argument. You don’t need to solve any of these problems in their entirety to add business value. Compared to the big brands, agility is how you win. You need to inject jet fuel to accelerate testing of these concepts. Believe me, your ecosystem is less complex than what big brands are dealing with. Luckily, you’re not alone and we have a few tips for each of these challenges:
1. Our data is too messy
- Break down the problem into smaller chunks
- Clean the most important data for the most important problems
- Being directionally correct is better than precisely inaccurate
2. Our team doesn’t have the right skills
- Find a partner to accelerate your team’s growth
- Build a team of continuous learners with interest in the problem (Udemy has great courses)
- Leverage self-service, no-code technology to bridge the gap
3. Our processes need to be standardized
- No, they don’t.
4. Our technology is outdated
- Does anyone in your business know Excel? Try XLStat
- Want a no-code interface? Try BigML
- Want automatic ecommerce recommendations? Try Unified Analytics
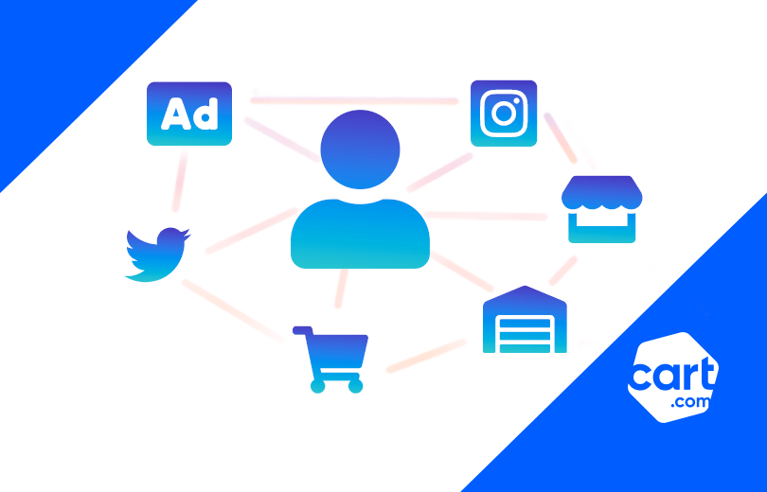
In the race for business growth, Cart.com’s Unified Analytics acts as a team of analysts, augmenting your gut feel with predicted outcomes based on position, performance and other critical factors. This solution connects the world of your ecommerce data across marketing, sales, web tracking and fulfillment channels.
With simple, self-service workflows designed for non-technical professionals that automate data integration needs, you and your team can accelerate the time-to-value of your data in less than two weeks. Cart Unified Analytics also combines proprietary Pixel and machine learning technologies to recommend how best to attract customers, convert them on your website or other marketplaces, and then fulfill on the promise of an accurate and quick delivery.
With Cart Unified Analytics, you’ll be able to:
- Optimize ad channels with AI-driven attribution
- Increase the impact of incremental campaign spend
- Change marketing mix across both digital and non-digital channels
- Improve product availability for upcoming campaigns with growth & scenario planning
- Increase average order value with recommended bundles and cross-sells
- Optimize inventory turnover with demand planning and forecasting
Get in the driver’s seat and accelerate past the competition.
Get a free Unified Analytics consultation now.